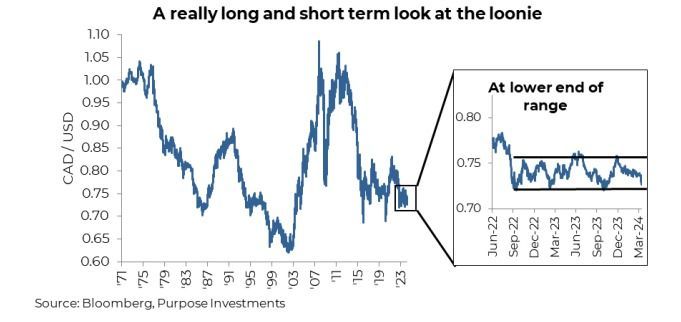
The CAD vs USD exchange rate has certainly been on the move over the past few months, to the detriment of the loonie. After rising into year-end to finish 2023 at about 75 ½ cents, the CAD has fallen down close to 72 ½ cents. The CAD is trading near the lower end of its recent range. Ah, remember the days when the loonie was on par with the U.S. dollar? Disney trips felt cheap, cross-border shopping was all the rage, and oil carried an average price of $96/bbl. Huh, with oil moving from the $70s to the high $80s, that sure doesn't match a 72 ½ cent loonie. Are we no longer a petrol currency? Maybe a decade of underinvestment and uncertainty around takeaway infrastructure can change a currency's stripes. Or there are other factors that are bigger than the oil impact on our currency exchange with the almighty dollar.
The weakness in the Canadian dollar is pretty easy to explain. U.S. inflation has ticked higher, as has the American economic data. Meanwhile, in Canada, the opposite trend is apparent. Just look at the Citigroup economic surprise indices for each country. This rolling index measures economic data releases relative to consensus forecasts, weighted based on the importance of each data release. Canada has averaged about -36, while the U.S. has been +40 so far in 2024. Not surprisingly, this has translated into a widening spread of 2-year yields, the tenor of yields most impactful on spot currency exchange rates. U.S. 2-year yields are 4.89% compared to 4.17% in Canada, roughly the widest spread over the past decade. This has also translated into expected central bank rate cuts. In January, the market consensus was pricing in a whopping seven cuts (25bps each) for the U.S. Fed Funds rate, while Canada was forecast to cut five times. Fast forward to today, they are tied at 2 ½ cuts each.
One important consideration is that the recent currency move in the loonie is more about USD strength than CAD weakness. While the CAD has lost about 5% against the USD so far this year, it has been relatively flat against other major currencies, such as the yen and euro. This really points to USD strength due to higher inflation, tempering of rate cuts, and better relative economic growth data.
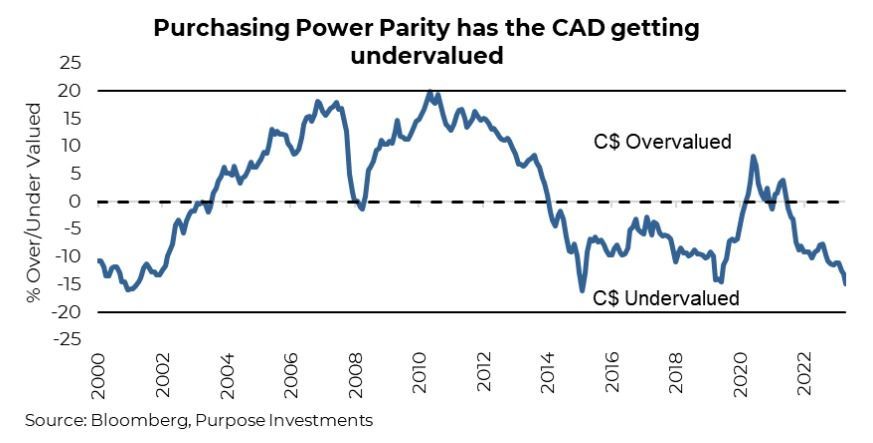
But at 72 ½ cents, is there value in the loonie? It is starting to look that way. There is no denying the CAD is undervalued, as highlighted in the purchasing power parity chart below. This doesn’t mean it will fix this undervaluation anytime soon; there are fast drivers of currencies (most of the previously mentioned factors), and then there are slow drivers. Valuation is a slow driver, as are deficits. Sure, everyone runs deficits; that isn’t anything new. But the U.S. has taken deficits to new levels outside a recession/war/pandemic environment. At some point, that will be a negative for the USD relative to more fiscally responsible national currencies. We’re not saying Canada is fiscally responsible, but it is on a relative basis compared to the U.S.
Final Thoughts
Currency exposure is an important component of managing multi-asset portfolios. We remain largely unhedged with our USD exposures, which has been the right call. Generally, we like being unhedged, as the USD can be a powerful diversification tool for Canadian portfolios. However, our conviction on this is waning; the further the CAD depreciates, the better the risk-return trade-off for hedging. We're not there yet, but it is starting to look rather interesting.
— Craig Basinger is the Chief Market Strategist at Purpose Investments
Source: Charts are sourced to Bloomberg L.P. and Purpose Investments Inc.
The contents of this publication were researched, written and produced by Purpose Investments Inc. and are used by Echelon Wealth Partners Inc. for information purposes only.
This report is authored by Craig Basinger, Chief Market Strategist, Purpose Investments Inc.
Disclaimers
Echelon Wealth Partners Inc.
The opinions expressed in this report are the opinions of the author and readers should not assume they reflect the opinions or recommendations of Echelon Wealth Partners Inc. or its affiliates. Assumptions, opinions and estimates constitute the author's judgment as of the date of this material and are subject to change without notice. We do not warrant the completeness or accuracy of this material, and it should not be relied upon as such. Before acting on any recommendation, you should consider whether it is suitable for your particular circumstances and, if necessary, seek professional advice. Past performance is not indicative of future results. The comments contained herein are general in nature and are not intended to be, nor should be construed to be, legal or tax advice to any particular individual. Accordingly, individuals should consult their own legal or tax advisors for advice with respect to the tax consequences to them.
Purpose Investments Inc.
Purpose Investments Inc. is a registered securities entity. Commissions, trailing commissions, management fees and expenses all may be associated with investment funds. Please read the prospectus before investing. If the securities are purchased or sold on a stock exchange, you may pay more or receive less than the current net asset value. Investment funds are not guaranteed, their values change frequently and past performance may not be repeated.
Forward Looking Statements
Forward-looking statements are based on current expectations, estimates, forecasts and projections based on beliefs and assumptions made by author. These statements involve risks and uncertainties and are not guarantees of future performance or results and no assurance can be given that these estimates and expectations will prove to have been correct, and actual outcomes and results may differ materially from what is expressed, implied or projected in such forward-looking statements. Assumptions, opinions and estimates constitute the author’s judgment as of the date of this material and are subject to change without notice. Neither Purpose Investments nor Echelon Partners warrant the completeness or accuracy of this material, and it should not be relied upon as such. Before acting on any recommendation, you should consider whether it is suitable for your particular circumstances and, if necessary, seek professional advice. Past performance is not indicative of future results. These estimates and expectations involve risks and uncertainties and are not guarantees of future performance or results and no assurance can be given that these estimates and expectations will prove to have been correct, and actual outcomes and results may differ materially from what is expressed, implied or projected in such forward-looking statements. Unless required by applicable law, it is not undertaken, and specifically disclaimed, that there is any intention or obligation to update or revise the forward-looking statements, whether as a result of new information, future events or otherwise. Before acting on any recommendation, you should consider whether it is suitable for your particular circumstances and, if necessary, seek professional
advice.
The particulars contained herein were obtained from sources which we believe are reliable, but are not guaranteed by us and may be incomplete. This is not an official publication or research report of either Echelon Partners or Purpose Investments, and this is not to be used as a solicitation in any jurisdiction.
This document is not for public distribution, is for informational purposes only, and is not being delivered to you in the context of an offering of any securities, nor is it a recommendation or solicitation to buy, hold or sell any security.